Your Zabbix went red long ago. But nobody looks at it day to day?
A failure in the making sits red in Zabbix while nobody in operations knows about it. COD brings availability and open problems onto the living asset base you already work with. Problem detection and alerting remain Zabbix's job. COD reads and acknowledges. All of it runs fully on-premises and multi-tenant.
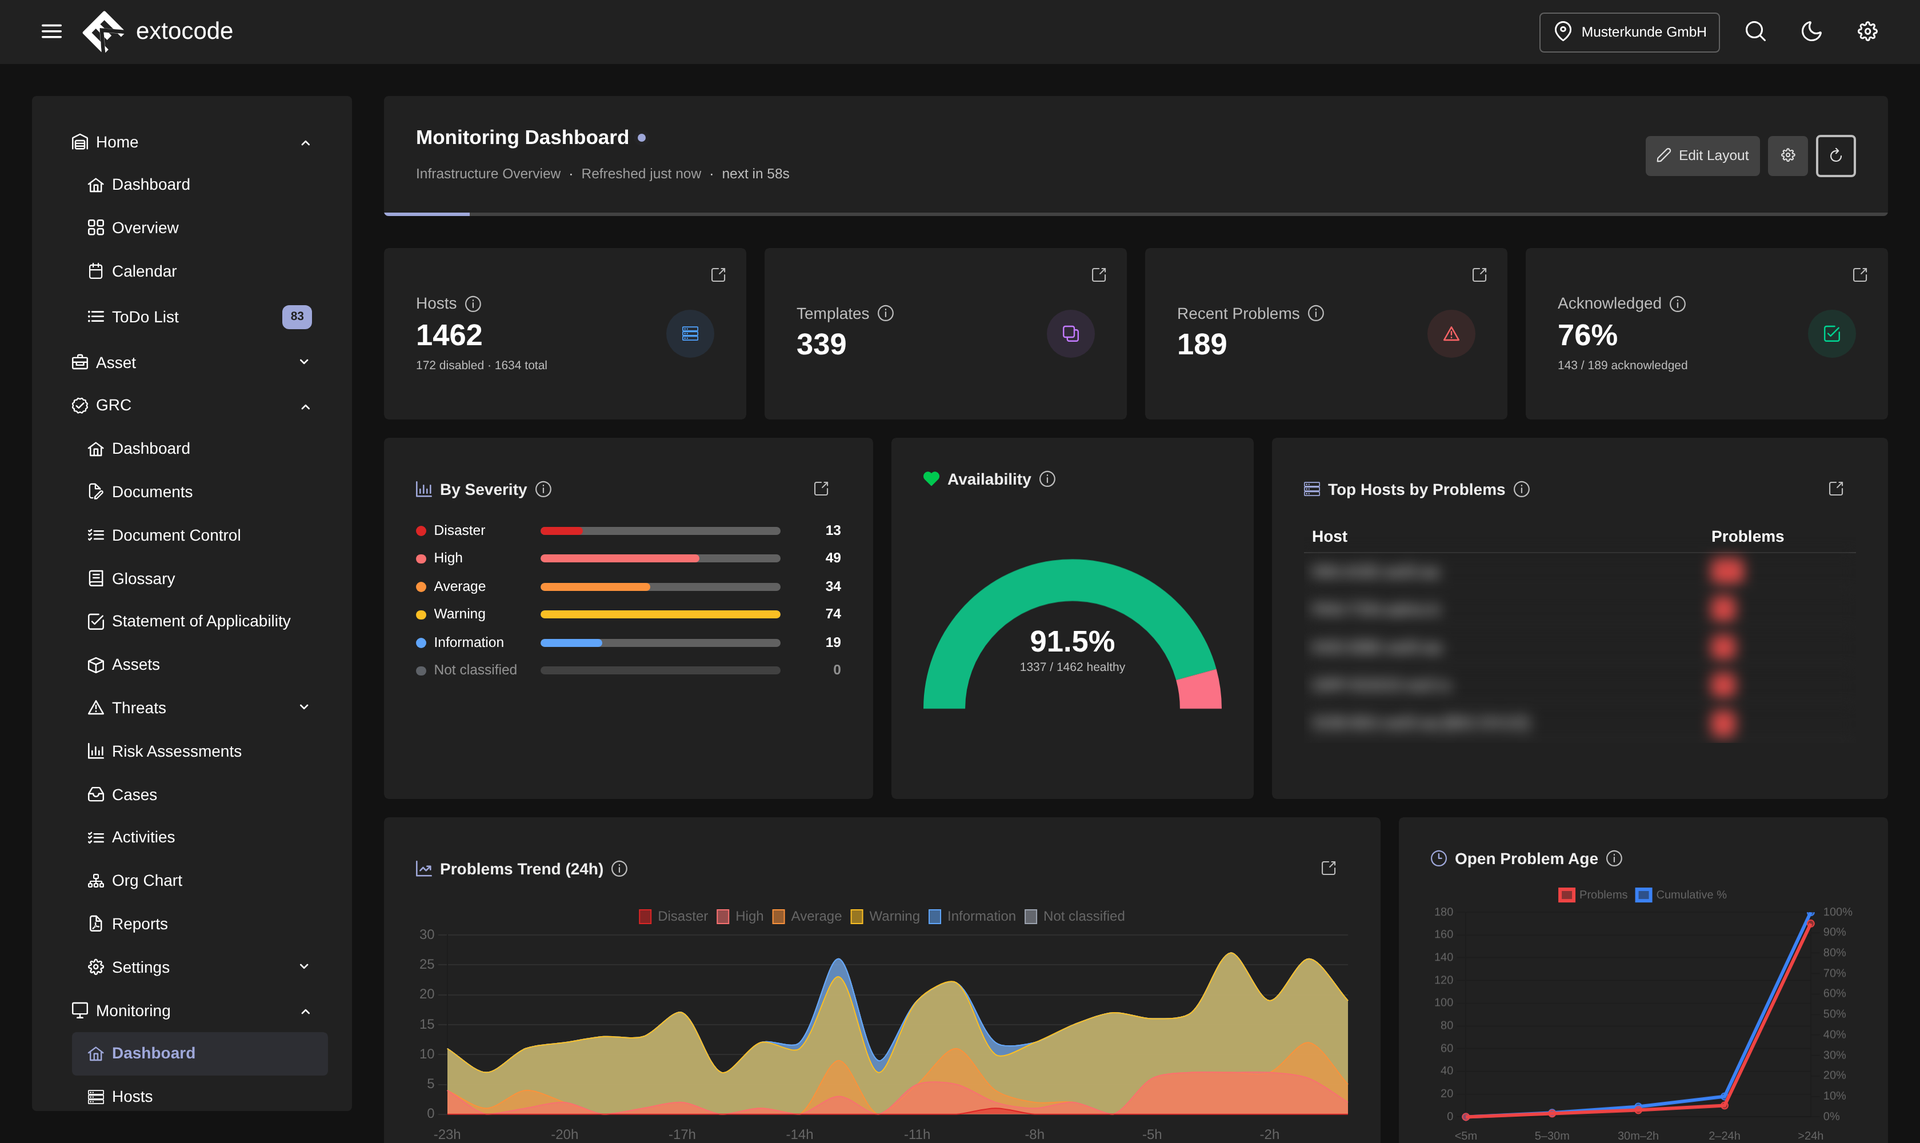
Monitoring dashboard: availability, open problems by severity and trends of the last 24 hours, from your Zabbix, in COD.
Know the feeling?
The data sits in Zabbix, but nobody looks at it
The pain: Your Zabbix reliably collects metrics and detects problems, but it is one more tool next to COD, with its own login and its own interface. In day-to-day business hardly anyone opens it.
The consequence: Availability figures and open problems sit unused in a tool that stays on the sidelines. The value of the monitoring evaporates.
How COD solves it: The monitoring module integrates your Zabbix server into COD through a backend bridge: dashboard, hosts, templates, problems and unlinked assets, on the same living asset base as your operations. The dashboard refreshes itself regularly. Detection, triggers and alerting stay with Zabbix. COD brings the data to where the work happens.
Maintaining hosts in Zabbix means creating the same devices a second time
The pain: A new device needs monitoring, so you switch to Zabbix, create the host, assign templates, enter interfaces. You maintain the same assets twice, and nowhere can you see at a glance which devices are not monitored at all yet.
The consequence: Double maintenance for every new device, plus monitoring gaps nobody notices. In an emergency an asset fails unnoticed.
How COD solves it: You create Zabbix hosts directly from the asset dialog in COD, including hostname, templates, host groups and interfaces. The "Unlinked Assets" view shows coverage gaps. If you switch monitoring off, COD only removes its own link. COD never deletes a Zabbix host.
One Zabbix for many customers, but no clean tenant separation
The pain: As a service provider or municipality you run one Zabbix for several customers or sites. Zabbix does not know this separation out of the box: whoever opens the interface sees hosts and problems of all tenants mixed together.
The consequence: Every customer view is a mix-up risk: problems get attributed to the wrong customer, and any per-customer report means filtering by hand.
How COD solves it: COD filters the monitoring views per site through Zabbix host groups: each tenant sees only its own hosts, problems and templates, configured via multiselect. You acknowledge open problems directly from COD, and COD appends who acknowledged to the comment server-side.
Why COD, not just a feature
COD does not put a second monitoring system next to Zabbix. It brings your existing monitoring onto the living asset base of your operations: one data set instead of two tools. Everything runs on-premises and multi-tenant, so a shared Zabbix becomes cleanly usable per customer for the first time, without switching tools.
Frequently asked questions
See monitoring live
Request a live demo and see the monitoring module with your Zabbix in your own environment, or download the datasheet with all features compactly on one page.